- Home
- Investor Relations
- Financial Date
- Financial Highlights
Financial Highlights
Millions of Yen
| 2015 | 2016 | 2017 | 2018 | 2019 | ||
|---|---|---|---|---|---|---|
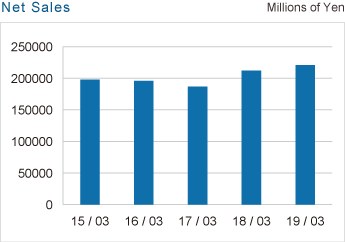
| Net sales | 197,615 | 195,806 | 186,629 | 212,119 | 220,661 | |
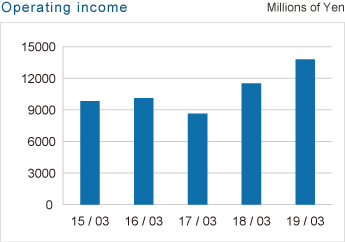
| Operating income | 9,821 | 10,115 | 8,639 | 11,499 | 13,800 | |
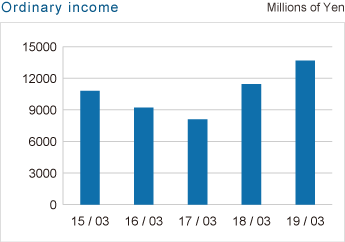
| Ordinary income | 10,794 | 9,208 | 8,101 | 11,437 | 13,661 | |
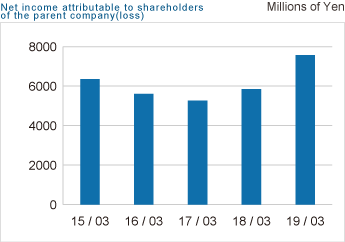
| Net income attributable to shareholders of the parent company (loss) | 6,356 | 5,613 | 5,263 | 5,842 | 7,567 | |
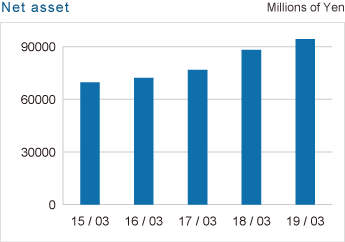
| Net asset | 69,628 | 72,160 | 76,730 | 88,123 | 94,214 | |
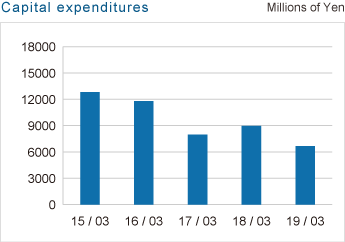
| Capital expenditures | 12,824 | 11,780 | 7,958 | 8,980 | 6,674 | |
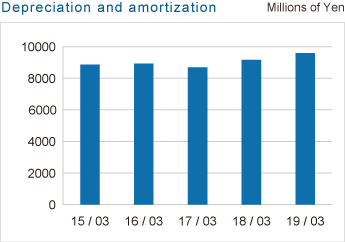
| Depreciation and amortization | 8,853 | 8,921 | 8,687 | 9,167 | 9,586 | |
| Dividends per share | End of second quarter | 5 yen | 5 yen | 5 yen | 6 yen | 6.5 yen |
| Year-end | 6 yen | 6 yen | 6 yen | 6 yen | 7.5 yen | |

