- Home
- Investor Relations
- Financial Date
- Segment Information
Segment Information
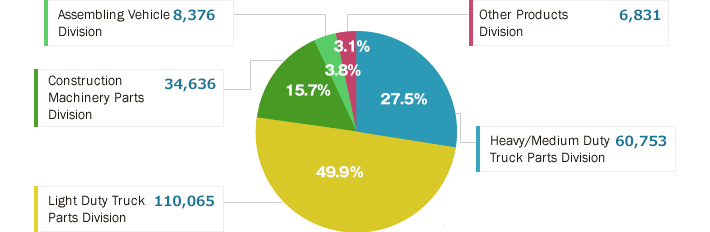
Sales by Product Group
Millions of Yen
| 2015 | 2016 | 2017 | 2018 | 2019 | |
|---|---|---|---|---|---|
| Heavy/Medium Duty Truck Parts Division | 67,022 | 65,257 | 58,518 | 65,528 | 60,753 |
| % | 33.9 | 33.3 | 31.4 | 30.9 | 27.5 |
| Light Duty Truck Parts Division | 86,020 | 94,286 | 92,582 | 102,508 | 110,065 |
| % | 43.5 | 48.2 | 49.6 | 48.3 | 49.9 |
| Construction Machinery Parts Division | 29,989 | 21,900 | 23,214 | 31,774 | 34,636 |
| % | 15.2 | 11.2 | 12.4 | 15 | 15.7 |
| Assembling Vehicle Division | 9,010 | 8,371 | 6,469 | 6,978 | 8,376 |
| % | 4.6 | 4.3 | 3.5 | 3.3 | 3.8 |
| Other Products Division | 5,574 | 5,992 | 5,846 | 5,331 | 6,831 |
| % | 2.8 | 3.1 | 3.1 | 2.5 | 3.1 |
| Total | 197,615 | 195,806 | 186,629 | 212,119 | 220,661 |
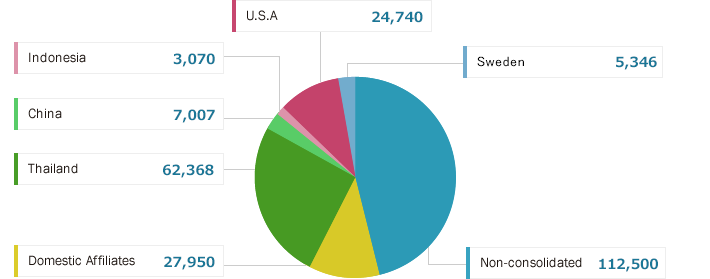
Sales by Regional Operations
Millions of Yen
| 2015 | 2016 | 2017 | 2018 | 2019 | |
|---|---|---|---|---|---|
| Non-consolidated | 124,569 | 111,777 | 102,303 | 110,127 | 112,500 |
| Domestic Affiliates | 24,509 | 21,686 | 22,919 | 26,881 | 27,950 |
| Thailand | 43,240 | 47,982 | 48,196 | 58,711 | 62,368 |
| China | 4,965 | 3,156 | 3,911 | 6,511 | 7,007 |
| Indonesia | 2,090 | 2,131 | 1,736 | 2,356 | 3,070 |
| U.S.A | 18,386 | 22,695 | 22,804 | 23,057 | 24,740 |
| Sweden | 6,070 | 5,868 | 4,834 | 6,144 | 5,346 |
| Adjustments | (26,214) | (19,489) | (20,074) | (21,668) | (22,320) |
| Total | 197,615 | 195,806 | 186,629 | 212,119 | 220,661 |